The Australian Securities and Investments Commission (ASIC) and the Australian Financial Security Authority (AFSA) have released their Insolvency Statistics for the 2015 – 2016 financial year which highlighted an increase in both corporate and personal insolvency, following the 2014-2015 decrease.
CORPORATE INSOLVENCY
Total corporate insolvency appointments increased by 8.8% from 12,726 during the 2015 financial year to 13,853 for the 2016 financial year, with 31% of appointments occurring in New South Wales.
While New South Wales has almost 1/3 of Australia’s external administrations, it continued to record the lowest number of corporate insolvency appointments since the 2005 financial year, remaining relatively consistent to those in 2015.
Queensland experienced the greatest number of corporate appointments with an increase of 13.8% from 2,667 in 2015 financial year to 3,036 in the 2016 financial year.
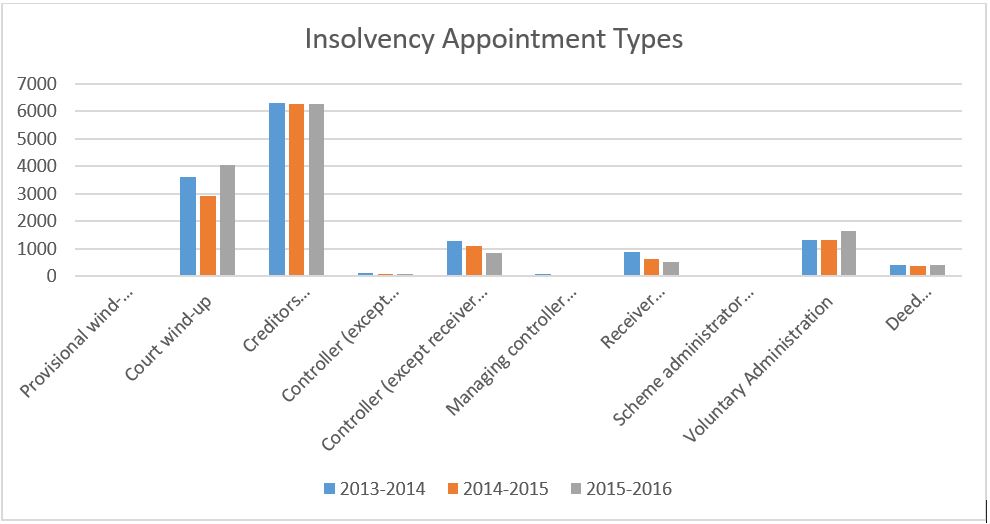
The below graph shows the total number of corporate insolvency appointments for the 2014, 2015 and 2016 financial years by type:
There was an increase in provisional liquidations (increase of 173.33%) and Court Liquidations (37.99%), while experiencing a decrease in controller and receiverships.
The primary causes of corporate failure nationally for the 2016 financial year were reported as:
- Inadequate cash flow or high cash use;
- Poor strategic management;
- Poor financial control including lack of records;
- Other reasons;
- Trading losses; and
- Poor economic conditions.
The primary reported breaches of director’s civil obligations and post appointment criminal obligations nationally for the 2016 financial year were reported as:
- Section 588G(1) – Insolvent Trading
- Sections 286 & 344 – Obligation to Keep Financial Records
- Section 180 – Due Care and Diligence
- Section 181 – Good Faith
- Section 530A – Offices to help Liquidator
Although we have experienced a relatively consistent number of appointments in New South Wales during the 2016 financial year, we have seen an increased number of enquiries from businesses operating in the construction and service industries.
The Local Market – Shaw Gidley
Shaw Gidley also experienced the national trend in New South Wales for 2016 with a consistent number of corporate appointments to those in 2015, however, the number of court liquidations has almost doubled during that time.
In line with the national statistics, the primary causes for corporate failure reported by Shaw Gidley were poor strategic management of the business and inadequate cash flow or poor financial control.
Our July 2014 newsletter outlined that by looking through our “crystal ball” we expected that the fallout of the mining services sector would result in an influx of the skilled labour into the local building and construction industry. We anticipated that the influx of skills would see an increase in competition within that industry, resulting in some form of corporate failures within the corporate industry. Looks like our crystal ball predictions came through!
PERSONAL INSOLVENCY
Total personal insolvency appointments increased by 4.4% from 28,288 during the 2015 financial year to 29,527 for the 2016 financial year, with 29.6% occurring in New South Wales.
The total number of personal insolvencies in the 2016 financial year compared to the 2015 financial year, can be summarised by type as follows:
- Bankruptcies increased by 0.2%
- Debt Agreements increased by 11.4%
- Personal Insolvency Agreements decreased by 18.2%
The number of appointments in New South Wales remained relatively consistent between the 2015 and 2016 financial years, with the Northern Territory, Western Australian and Queensland experiencing the highest increase:
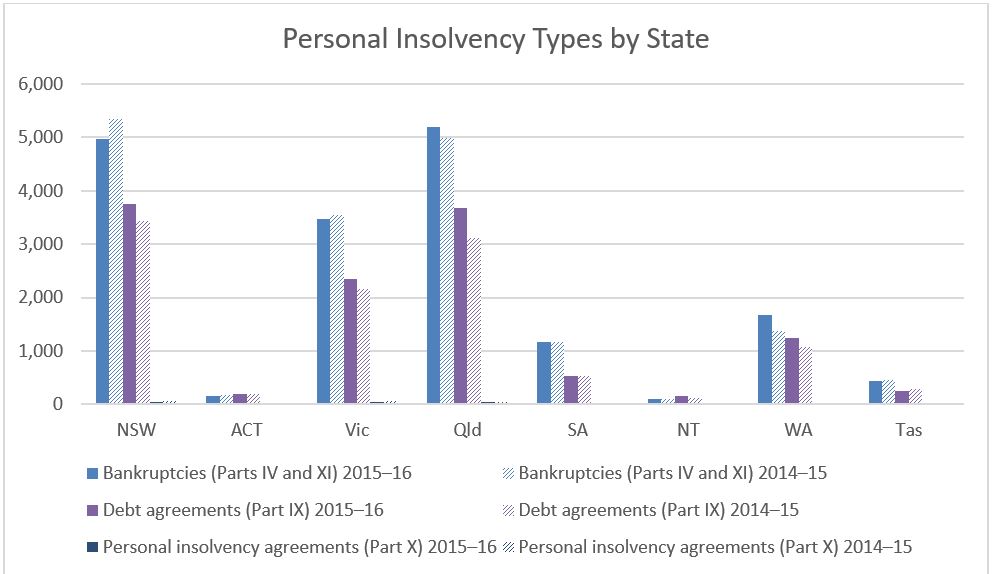
There were a total of 17,202 bankruptcies in the 2016 financial year, a rise of 0.2% from the 2015 financial year of 17,163, of which Western Australia contributed a 22.7% increase. This is the first annual rise in bankruptcies seen since the 2009 financial year.
Debt Agreements totalled 12,150 in the 2016 financial year, a rise of 11.4% from the 2015 financial year of 10,911. This was the highest level of Debt Agreements on record, with the Northern Territory accounting for an increase of 17.6% and Queensland an increase of 17.6%.
Personal Insolvency Agreements decreased 18.2% in the 2016 financial year from 214 in the 2015 financial year to 175. South Australia and the Australian Capital Territory represented the highest decrease of 52.6% and 50%, respectively.
The Local Market – Shaw Gidley
Unlike the remainder of New South Wales, Shaw Gidley experienced a 23% increase in the number of bankruptcies in 2016 compared to 2015.
Again, looking through our crystal ball and based on the level of enquires recently, we expect to see the number of bankruptcies increase again in the 2017 year, as well as a continued growth in the number of Debt Agreements administered.
Shaw Gidley are experts in restructuring, turnaround and insolvency and provide free initial advice on these matters. Please contact our offices on (02) 4908 4444 or (02) 6580 0400.